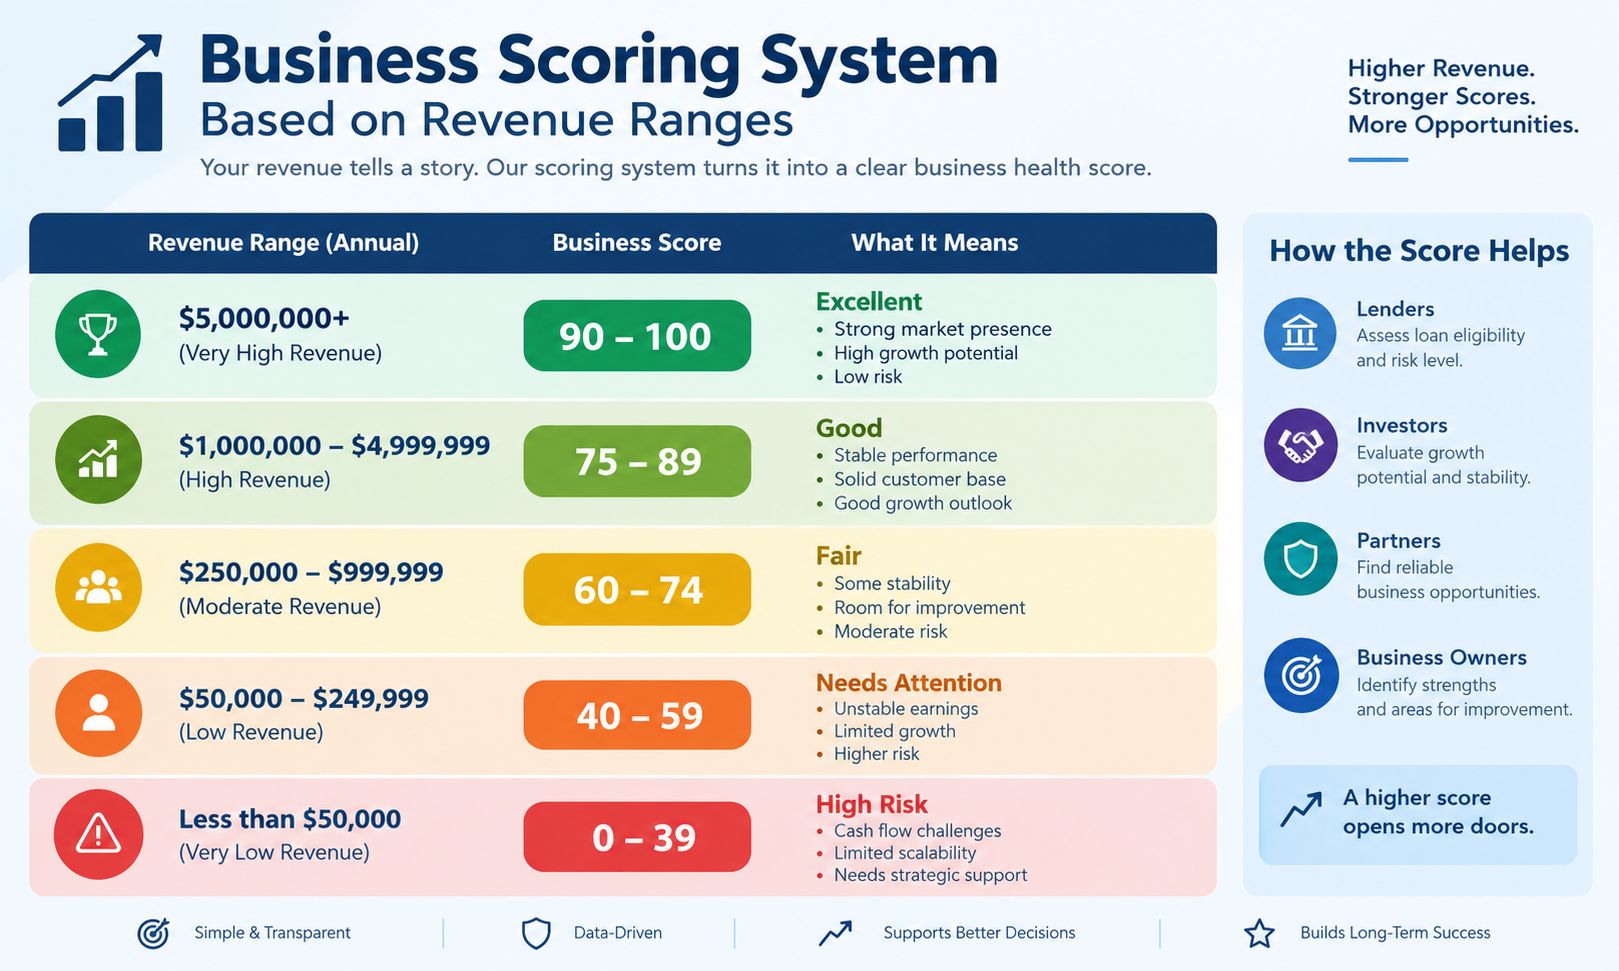
A company turning over £800,000 and a company turning over £80 million should not wait in the same queue. Teams usually know this, yet many still decide who gets a call, a discount or a faster support reply by instinct. Scoring rules for revenue bands replace instinct with a written rule: split turnover into ranges, attach points to each range, and let the points drive the decision.
This guide explains how the rules work, shows worked examples in pounds, covers the edge cases that quietly break most spreadsheets, and finishes with formulas for Excel, SQL and Python plus a template you can copy.
Quick answer: A scoring rule for revenue bands sorts each company into a turnover range and gives that range a fixed number of points. The points show how well the range fits your goal, such as lead priority, support level or supplier checks. For example, a £6m company might fall in a £1m to under £15m band worth 4 points, while a £70m company falls in a £54m to under £250m band worth 9. Set the bands and points from your own results, not from a generic list.
Table of Contents
ToggleHow revenue band scoring works
Every working rule follows the same chain:
- Capture the revenue figure from a form, your CRM, a data provider or filed accounts.
- Clean it so it uses one currency, one period and one definition of revenue.
- Place it in a band using boundaries that are written down.
- Look up the points attached to that band.
- Combine those points with other factors if revenue is only part of the decision.
- Act on the result: route the lead, set the support tier or trigger a supplier check.
The arithmetic is simple. The care goes into steps one to three, because a wrong input or an unclear boundary spoils everything that follows.
Start with bands people already recognise
You can pick round numbers and hope for the best, but a better starting point is a set of thresholds your market already uses. In the UK, the Companies Act sets size categories for company accounts. For financial years beginning on or after 6 April 2025, the turnover limits are £1m for a micro-entity and £15m for a small company, with medium-sized companies topping out at £54m. Anything larger counts as a large company. A business has to meet two of three tests (turnover, balance sheet total and employee numbers), so turnover alone does not decide its legal size. The GOV.UK guidance on company accounts sets out the tests.
These lines are useful because accountants, buyers and regulators already talk in these terms, which makes your bands easy to explain. They are a starting point, not a law of nature. A £14.9m company and a £15.1m company are not meaningfully different buyers, so check the lines against your own sales data before you rely on them.
At the bottom end, you may want a separate band for businesses below the VAT registration threshold (currently £90,000 of taxable turnover), since these are typically very small traders. Check GOV.UK for the current figure before you hard-code it.
Here is a five-band template built on those lines. The first three boundaries follow the Companies Act turnover limits; the £250m line is only an example.
| Band | Turnover | Label | Points | Typical action |
|---|---|---|---|---|
| 1 | £0 to under £1m | Micro | 1 | Automated nurture or self-serve |
| 2 | £1m to under £15m | Small | 4 | Inside sales qualification |
| 3 | £15m to under £54m | Medium | 7 | Account executive |
| 4 | £54m to under £250m | Large | 9 | Senior account executive plus solutions specialist |
| 5 | £250m and above | Enterprise | 10 | Named account with an executive sponsor |
The points are placeholders. The next section shows how the same bands can carry very different points depending on what you sell.
Five examples of scoring rules for revenue bands
The bands stay put; the points change with the goal. Every example below uses turnover in pounds.
1. A software vendor selling to mid-sized firms
This vendor wins most often with medium-sized companies, so the highest score sits in the middle of the range.
| Turnover | Points | Reasoning |
|---|---|---|
| Under £1m | 1 | Limited budget and little time to roll out new software |
| £1m to under £15m | 6 | Workable fit, smaller contracts |
| £15m to under £54m | 10 | Real budget and manageable approvals |
| £54m to under £250m | 7 | Larger contracts, slower sign-off |
| £250m and above | 3 | Heavy procurement and security reviews the product is not built for yet |
A £300m company scores 3 here, far below a £20m company on 10. Higher revenue does not automatically mean a better lead. The score reflects fit, not size.
2. A self-serve product for small businesses
| Turnover | Points | Reasoning |
|---|---|---|
| Under £90,000 | 6 | Signs up quickly, but spend per account is small |
| £90,000 to under £2m | 10 | Owners decide fast and upgrade often |
| £2m to under £15m | 7 | Still comfortable with self-serve, but wants more features |
| £15m and above | 3 | Expects contracts, single sign-on and onboarding the plan does not include |
3. Advertising or sponsorship sales
A publisher or agency can use revenue bands to decide which package to pitch first.
| Advertiser turnover | Points | Package to lead with |
|---|---|---|
| Under £250,000 | 2 | Single sponsored post |
| £250,000 to under £2m | 5 | Starter bundle: sponsored post plus newsletter slot |
| £2m to under £15m | 8 | Quarterly campaign with reporting |
| £15m and above | 10 | Annual partnership with a named account manager |
Turnover shows capacity to spend, not intent, so pair this score with a buying signal such as a recent campaign or an enquiry.
4. Customer support tiers
| Customer turnover | Tier | First-response target | Coverage |
|---|---|---|---|
| Under £1m | Standard | 1 working day | Help centre and email |
| £1m to under £15m | Plus | 8 working hours | Email and live chat |
| £15m to under £54m | Priority | 4 working hours | Named support contact |
| £54m and above | Strategic | 1 hour | Account manager and phone line |
Many teams base tiers on contract value instead, because a very large company on a very small plan should not automatically receive strategic support. Use turnover as a guide, not the only trigger.
5. Supplier checks
| Supplier turnover | Stability points | Checks to run |
|---|---|---|
| Under £250,000 | 2 | Accounts, insurance certificates, references and a review of payment terms |
| £250,000 to under £1m | 4 | Accounts and references |
| £1m to under £15m | 7 | Standard onboarding checks |
| £15m and above | 9 | Standard checks plus group structure and filing history |
Turnover says little about profit, debt or cash. A £30m supplier can be in difficulty and a £400,000 one can be rock solid, so treat this score as a prompt for the right level of checking, not a verdict.
Turn the band score into a decision with weights
Revenue rarely decides anything on its own. Most teams blend it with other signals and act on the total:
Total score = the sum of (factor score × weight) for every factor, with the weights adding up to 100%.
Here is a worked example. Band points run from 0 to 10, so multiply them by 10 to put revenue on the same 0 to 100 scale as the other factors. The account is a fictional haulage firm, Northfield Logistics, with £8.4m turnover. Under example 1 it falls in the £1m to under £15m band, worth 6 points.
| Factor | Score (0 to 100) | Weight | Contribution |
|---|---|---|---|
| Revenue band (6 of 10) | 60 | 30% | 18.0 |
| Industry fit | 80 | 25% | 20.0 |
| Engagement | 60 | 25% | 15.0 |
| Employee band | 50 | 20% | 10.0 |
| Total | 100% | 63.0 |
Suppose the team’s rule is that 70 or more goes to sales, 50 to under 70 stays in nurture, and anything lower stays on the marketing list. Northfield scores 63, so it stays in nurture. Then the company requests a demo and visits the pricing page, which lifts its engagement score to 90. That contribution rises to 22.5 and the total becomes 70.5, so the account passes to sales. Revenue did not change; behaviour did.
Be careful what counts as engagement. Reach is not the same as real engagement, so award points for actions that signal intent, such as demo requests and pricing-page visits, rather than for raw impressions or likes.
You do not have to do this by hand. Most CRMs can calculate it for you, and HubSpot’s guide to building lead scores shows how fit scores built from company properties sit alongside engagement scores and score thresholds.
Write boundaries so nobody can misread them
Bands must not overlap, and every possible value must land somewhere. Give each band one inclusive end and one exclusive end:
| Band | Rule |
|---|---|
| 1 | turnover ≥ £0 and < £1,000,000 |
| 2 | turnover ≥ £1,000,000 and < £15,000,000 |
| 3 | turnover ≥ £15,000,000 and < £54,000,000 |
| 4 | turnover ≥ £54,000,000 and < £250,000,000 |
| 5 | turnover ≥ £250,000,000 |
With these rules, £999,999 is Band 1 and £1,000,000 is Band 2. Compare that with bands labelled “up to £1m” and “£1m to £15m”, where a £1m company fits both and two analysts can score it differently.
One wrinkle: the Companies Act wording is “not more than”, so a company with exactly £1m turnover is still a micro-entity in law. If you want your bands to mirror the Act precisely, use ≤ at the top of each band instead. Either convention works as long as you pick one and write it down.
Clean the revenue figure before you score it
Revenue arrives as “£5m”, “5 million”, “5,000,000”, “GBP 5.0m” and “€6m”. Convert everything to a plain number before it goes near a band. Four checks catch most problems:
- One currency. Convert at a stated rate and store the rate and the date.
- One period. Use the latest full financial year and record the year-end, because comparing a March year-end with a December one distorts the picture.
- One definition. Turnover, annual recurring revenue (ARR) and gross profit are different things. If you hold monthly recurring revenue (MRR), multiply by 12 on purpose and label the result as annualised.
- One source. Record whether each figure came from filed accounts, a data provider or a form someone filled in.
Add a sanity check as well. Revenue per employee is a quick test: a 12-person firm reporting £400m is almost certainly a typo.
Many small companies are not required to publish their profit and loss account, so turnover is often missing from Companies House. You may need a data provider or a direct answer from the customer. Small firms that keep clear, accurate financial records can usually confirm their turnover quickly when asked.
What to do when revenue is missing, zero or estimated
These are three different situations, and treating them alike is how bad data hides inside a score.
| Situation | What it means | How to handle it |
|---|---|---|
| Confirmed £0 | A genuine pre-revenue or newly formed company | Score it in the lowest band and mark the figure as confirmed |
| Unknown | You have no reliable figure | Do not score it as low; flag it as unknown and use the rule below |
| Estimated | The figure is modelled or inferred | Score it, but store the source and a confidence level |
The cleanest way to handle unknown revenue is to leave the factor out of the total and rescale the remaining weights, so the company is neither rewarded nor punished for missing data:
Total = sum of (score × weight) for the factors you have ÷ sum of the weights you used
Take Northfield again, with its revenue figure missing. The other three factors give 20.0 + 15.0 + 10.0 = 45.0, and their weights add up to 70% (0.70). Dividing gives 45.0 ÷ 0.70 = 64.3, so the account still lands in nurture, and a data-quality flag tells someone to find the missing figure.
Revenue size and revenue growth are different signals
A £12m company growing 45% a year and a £120m company growing 1% can both deserve attention, for different reasons. A model that reads size alone will underrate the first. Give growth its own line in the weights, calculate it from the last two years of turnover, and check whether an acquisition rather than organic growth explains a jump.
How revenue bands compare with other scoring methods
| Method | Best for | Watch out for |
|---|---|---|
| Sorting by raw revenue | A quick ranking | A few very large figures dominate the list |
| Revenue bands | Simple, explainable groups | Cliff edges at each boundary |
| Percentile scoring | Ranking within one dataset | Scores shift whenever the dataset changes |
| Weighted multi-factor score | Decisions that need several signals | Weights need testing |
| Machine-learning model | Complex patterns with plenty of history | Harder to explain to the team |
Bands do have cliff edges: a £14.9m firm and a £15.1m firm score differently while looking almost identical. If that matters for your use case, blend revenue with other factors or use percentile scoring for the final ranking.
Revenue bands are not a valuation tool
A revenue band tells you how to treat a company. It does not tell you what the company is worth. A valuation depends on profit, growth, margins, the share of recurring income, debt and how reliant the business is on a few customers, so attaching a fixed multiple to a band gives misleading answers. If you need a valuation, use a proper valuation method and speak to a qualified adviser. This article is general information, not financial advice.
Build it in Excel, SQL and Python
Excel
List the band floors in F2:F6 (0, 1000000, 15000000, 54000000, 250000000) and the points in G2:G6 (1, 4, 7, 9, 10). Then use:
=IF(ISNUMBER(A2),XLOOKUP(A2,$F$2:$F$6,$G$2:$G$6,"Check data",-1),"Unknown")The -1 tells XLOOKUP to return the exact match or the next smaller floor, so £1,000,000 lands in Band 2 and £999,999 in Band 1. The ISNUMBER check stops blank cells being scored as zero. Older versions of Excel can use =IF(ISNUMBER(A2),VLOOKUP(A2,$F$2:$G$6,2,TRUE),"Unknown") with the floors sorted from smallest to largest. A lookup table beats a nested IF once you pass three or four bands, because you edit cells instead of formulas.
SQL
SELECT
  company_id,
  turnover_gbp,
  CASE
    WHEN turnover_gbp IS NULL OR turnover_gbp < 0 THEN NULL
    WHEN turnover_gbp < 1000000   THEN 1
    WHEN turnover_gbp < 15000000  THEN 4
    WHEN turnover_gbp < 54000000  THEN 7
    WHEN turnover_gbp < 250000000 THEN 9
    ELSE 10
  END AS revenue_points
FROM companies;
CASE checks each line in order and stops at the first match, so list the bands from smallest to largest. Missing or invalid values return NULL rather than a score. If your bands change often, store them in a revenue_bands table with minimum and maximum columns and join to it, so you edit rows instead of code.
Python
import math
from bisect import bisect_right

FLOORS = [0, 1_000_000, 15_000_000, 54_000_000, 250_000_000]
POINTS = [1, 4, 7, 9, 10]

def revenue_points(turnover):
    """Return the band points, or None if turnover is missing or invalid."""
    if turnover is None or math.isnan(turnover) or turnover < 0:
        return None
    return POINTS[bisect_right(FLOORS, turnover) - 1]
For a whole table of data, pandas does the same job:
import numpy as np
import pandas as pd

bins = [0, 1_000_000, 15_000_000, 54_000_000, 250_000_000, np.inf]
df["revenue_points"] = pd.cut(df["turnover_gbp"], bins=bins, labels=POINTS, right=False)
right=False makes each band include its lower edge and exclude its upper edge, matching the rule above, and missing values come back empty instead of scored.
Whichever tool you use, test the same five inputs in each: 999,999, 1,000,000, 14,999,999, 15,000,000 and a blank. You should get 1, 4, 4, 7 and “unknown”, so a company is never scored differently depending on which system handled it.
Test and maintain your bands
A set of bands is a hypothesis until real results back it up.
- Backtest. Score last year’s won and lost deals with today’s bands, then compare conversion rate, average deal value, sales-cycle length and retention by band.
- Merge bands that behave alike. If two neighbouring bands produce the same results, one of them is not earning its place.
- Version the rules. Keep a version number and date so scores from different periods stay comparable.
- Review on a schedule. Once a year is a sensible baseline, plus after changes to your product, pricing or target customer.
- Write down the why. Record who owns the rules, where they live and why each boundary sits where it does.
Common mistakes
- Scoring missing revenue as £0. It hides a data problem inside what looks like a size signal.
- Leaving boundaries open to interpretation. Two people will score the same £1m company differently.
- Assuming bigger is better. The top score belongs to the band that fits your offer, as example 1 shows.
- Using revenue as an automatic disqualifier. Unless you genuinely cannot serve small companies, a low score should lower priority, not delete the lead.
- Mixing turnover, ARR and gross profit in one column.
- Creating bands nobody acts on. If two bands trigger the same action, merge them.
- Never checking results. Without a backtest, the rule is a guess with a spreadsheet around it.
Frequently asked questions
What is an example of a scoring rule for revenue bands?
A vendor selling to medium-sized firms might give 1 point under £1m, 6 points from £1m to under £15m, 10 points from £15m to under £54m, 7 points from £54m to under £250m and 3 points above that.
How many revenue bands should I use?
Four or five suit most teams. Add a band only when it changes what someone does, such as a different sales route or support tier.
What is the difference between revenue and turnover?
In UK company accounts, turnover is the usual term for sales revenue. CRMs and data providers often label the same field “revenue” or “annual revenue”. Check the definition your source uses and keep it consistent.
What are the UK company size thresholds for turnover?
For financial years beginning on or after 6 April 2025, a micro-entity has turnover of £1m or less, a small company £15m or less and a medium-sized company £54m or less. Companies must meet two of three tests, so check the GOV.UK guidance before relying on turnover alone.
How should I score a company with unknown revenue?
Do not score it as zero. Flag the figure as unknown, leave the revenue factor out of the total and rescale the remaining weights, as shown above.
What is the Excel formula for revenue bands?
Build a band table and use XLOOKUP with match mode -1: =XLOOKUP(A2,$F$2:$F$6,$G$2:$G$6,"Check data",-1). Wrap it in ISNUMBER so blank cells are not scored.
How often should I update my revenue bands?
At least once a year, and after any change to your product, pricing or target customer. Keep a version number so old and new scores can still be compared.
Can revenue bands be used to value a business?
Not on their own. Valuation depends on profit, growth, debt and other factors, so use a proper valuation method and take professional advice.
Putting it into practice
Good scoring rules for revenue bands are simple, written down and tested. Start from boundaries your market recognises, give each band points that reflect your own goal, handle missing and zero figures deliberately, and check the results against real outcomes once a year. Copy the template above, change the points to match your data, and you will have a rule your whole team applies in the same way.
Related reading on 5ive Magazine: more business guides and how followers turn into paying fans.