Anyone pulling up New York Yankees vs Texas Rangers match player stats from this season is looking at one of the more lopsided individual performances you’ll find in a divisional-adjacent matchup all year. Aaron Judge and Ben Rice hit back-to-back home runs in Arlington, Cody Bellinger put together a near perfect night at the plate in the Bronx, and the Rangers’ offense showed real life in flashes without ever putting together enough to flip either series. The Yankees took both meetings this year, and the individual stat lines explain exactly why.
This breaks down the two series that mattered, the specific performances that decided them, and what those numbers tell you heading into the next time these two clubs meet.
Table of Contents
ToggleThe April Series in Arlington Set the Tone Early
New York opened its season series against Texas at Globe Life Field in late April, and the signature moment came on April 27 when Judge and Rice went deep in back-to-back at bats, the first time any Yankees duo had done that this season. Judge’s blast was his 11th home run of the year, coming a day after he’d hit one on his 34th birthday. Rice’s was his 10th, his sixth in an 11 game stretch, and the pairing meant both players had reached double digit home runs within the season’s first 29 games, matching a feat last accomplished by Mickey Mantle and Yogi Berra back in 1956. Jazz Chisholm Jr. added a third homer of his own that same game, and the Yankees won it 4-2.
Pitching-wise, Max Fried carried the load for six scoreless innings, scattering four singles and picking up the win to improve to 4-1. Closer David Bednar converted his eighth save in nine chances despite allowing an unearned run in the ninth. On the other side, Rangers starter Jack Leiter took the loss after giving up all three home runs across six innings, and pinch hitter Joc Pederson provided the lone offensive spark for Texas with a solo shot in the seventh. New York took that series and left Arlington firmly in control of the American League East race at the time, sitting well above .500 while Texas hovered closer to break even in a crowded AL West.
Why the Home Run Numbers Mattered More Than the Final Score
A 4-2 final score doesn’t look dramatic on paper, but the way New York scored those runs told the real story. Three solo shots accounted for three quarters of the offense, and that’s a pattern worth tracking with this Yankees lineup specifically. When Judge, Rice, and Chisholm are all going deep in the same game, the Yankees don’t need to string together long innings to win, they can manufacture a winning score in a handful of swings. That’s a very different offensive identity than a team that relies on working counts and stacking singles, and it changes how you should read a close final score involving this roster. A 4-2 win built on three homers reflects a dominant offensive night far more than the two run margin suggests.
The May Series in the Bronx Turned on One Huge Game
Texas and New York met again in early May, this time at Yankee Stadium, and split the first two games before New York blew the finale open. Game one went to the Yankees 7-4 after a back and forth affair: Texas jumped out 3-0 in the first inning on a sacrifice fly, an RBI single, and a run scoring on a wild pitch, but New York answered with a Bellinger double that scored Judge, a Chisholm home run to tie it, another Bellinger double that plated two more, and a Goldschmidt homer in the eighth that sealed it. Texas answered right back the next night, winning 6-1 to even the series and hand New York a rare quiet offensive game.
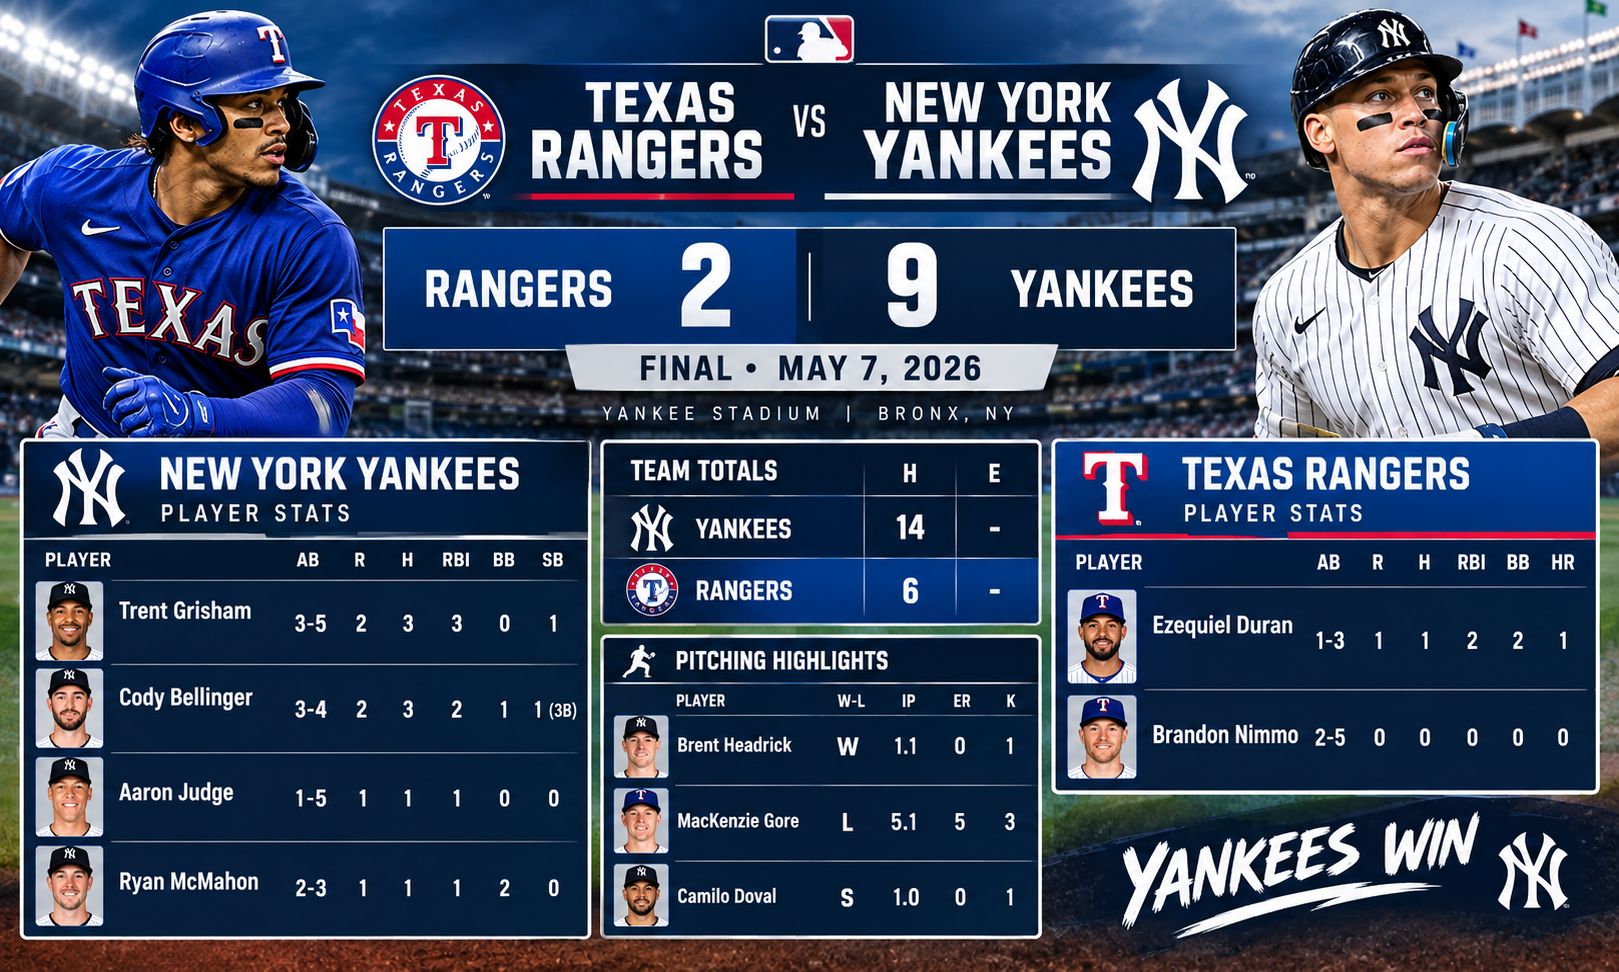
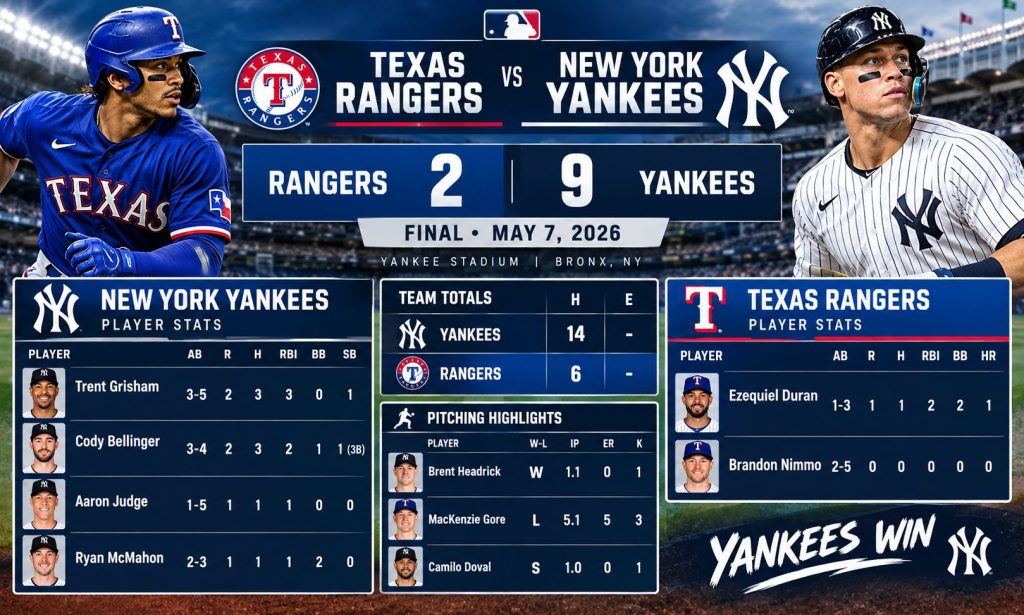
The finale on May 7 was where things got out of hand. New York won 9-2, and Bellinger’s stat line alone tells most of the story: four at bats, three hits, two runs scored, two walks, and a .750 average for the game that pushed his overall numbers up noticeably. Paul Goldschmidt added a two-hit, two-walk game of his own, reaching base in four of his five plate appearances. Judge went 1-for-5 with a walk, a quieter night by his standards but still enough to keep runners moving. On the Texas side, Ezequiel Duran had arguably their best individual game of the series, going 1-for-3 with a home run, two walks, and two RBI, but it wasn’t enough to offset a Yankees lineup that hit .290 as a team that night compared to Texas’s .194.
What These Numbers Say About Both Rosters Right Now
Zoom out to the full season and the gap between these two teams becomes clearer than either individual series suggested. New York has spent most of the year positioned near the top of the American League East, while Texas has settled into a middle of the pack American League West race that’s stayed tighter than New York’s division all season. That context matters when you’re reading box scores from their head to head meetings, because a team fighting for playoff seeding tends to play a different brand of baseball in the late innings than one jockeying for a wild card spot.
The historical numbers add another layer worth knowing. New York holds a wide edge in the all time series between these franchises, and had won four of the last six meetings heading into this year’s matchups, which lines up with what played out again this season. That’s not a coincidence so much as a reflection of roster construction. New York’s lineup has more players capable of hitting a ball out of the park on any given pitch, and that kind of power depth shows up disproportionately in short series against any opponent, not just Texas specifically.
The Pitching Matchups Deserve Equal Attention
It’s easy to focus entirely on the home run totals here, but the pitching lines from these series are just as telling. Fried’s six shutout innings in the April opener set the tone for how New York’s rotation approached the whole set: attack the zone, let the defense and bullpen finish the job. Texas’s rotation, by contrast, gave up extra base damage in bunches, with both Leiter and the pitchers who worked the May 5 loss allowing multiple home runs in outings that started reasonably well before unraveling in the middle innings. If you’re trying to project how a future series between these two clubs might go, the health and recent form of each team’s rotation depth matters more than any single hitter’s hot streak, since one shaky start can undo a strong offensive week in a hurry.
Bullpen Usage Told Its Own Story
The two series also offer a useful lesson in how bullpen management shapes a final score just as much as the starters do. New York’s David Bednar closing out that April opener on one run allowed, despite the ninth inning wobble, kept his converted-save streak alive at eight of nine chances, a number worth tracking separately from his ERA because it reflects how a manager trusts him in the highest leverage innings regardless of how clean the outing looks on paper. A closer who gets the job done in ugly fashion still gets the job done, and that distinction matters more in September than it does in April, when playoff races tighten and bullpen depth gets tested night after night.
Texas, on the other hand, didn’t get the same shutdown work from its relief corps across these series, and that shows up less in any single pitcher’s individual line and more in the cumulative runs allowed once a starter exited. A team can have a perfectly respectable rotation ERA and still lose series after series if its bullpen can’t hold a lead or keep a game close once the fifth or sixth inning turns over. That’s a pattern worth watching in Texas’s numbers going forward, separate from whatever any individual reliever’s strikeout total says on its own.
How to Read These Stat Lines Without Overreacting
A three or four game series is a small sample, and it’s easy to walk away from one big performance thinking it defines a player’s season. Bellinger’s .750 night in the May finale was a real, verifiable output, but it sat alongside quieter games earlier in the series where he didn’t factor into the scoring at all. The better habit is tracking a player’s stat line across a full month rather than anchoring to one standout game, since a hot week against a specific opponent doesn’t necessarily predict how that same player performs the next time these two teams meet.
The same logic applies to pitchers. Leiter’s rough outing in the April series doesn’t mean he’s suddenly a different pitcher than the one Texas has relied on throughout the year. It means he had a bad matchup against a Yankees lineup that was locked in on a specific night. Stack a pitcher’s strikeout rate, walk rate, and innings totals over several starts before drawing conclusions from any single line, box score included.
Frequently Asked Questions
Who had the best individual stat line in the 2026 Yankees-Rangers series?
Cody Bellinger’s performance in the May 7 finale stands out clearly, going three for four with two runs scored and two walks in a 9-2 Yankees win. Aaron Judge and Ben Rice’s back-to-back home runs in the April series are a close second for pure moment value.
Did the Rangers have any standout performers in these series?
Ezequiel Duran was Texas’s most productive hitter across the meetings, including a multi-walk, multi-RBI game with a home run in the May finale, even though the team came up short overall in that game.
Where can I find live player stats for the next Yankees-Rangers matchup?
MLB.com’s Gameday and ESPN’s box score pages update in real time during games and remain the most reliable places to check current stat lines, since anything written as a season recap becomes dated the moment a new series starts.
Does the season series result actually matter for playoff seeding?
It can serve as a tiebreaker in some scenarios, but a team’s overall record against the full league carries far more weight than any head to head result against one opponent. New York’s stronger position in the standings this season reflects performance across dozens of series, not just this one.